
The foundation of our work is the data that drives our decision-making. It helps us:
- Identify needs & target resources: Understand the community’s health, social, and economic challenges and invest where it matters most.
- Set priorities: Focus on the issues with the greatest impact on residents’ well-being.
- Measure progress: Track the effectiveness of initiatives over time and adjust strategies for continuous improvement.
- Ensure equity: Identify and address disparities in health, resources, and opportunities across different populations.
Transparency & Accountability: Data shows progress and builds trust with the community. Using data makes community planning more informed, targeted, and impactful. Continue reading below to learn about the types of data we use in our work, where it comes from, and what we have learned from the most recent data we have gathered.
Visit our data dashboard for data related to our priorities.

How we measure health
Living a long life and avoiding illness are important, but they’re just pieces of the puzzle when it comes to overall health. We delve deeper than simply tracking illnesses and lifespans. For our Community Health Assessments, we use the Population Health Framework to explore a wide range of factors that influence a community’s health. We analyze data on things that might seem unrelated to health at first glance, but which have a significant impact on our well-being.
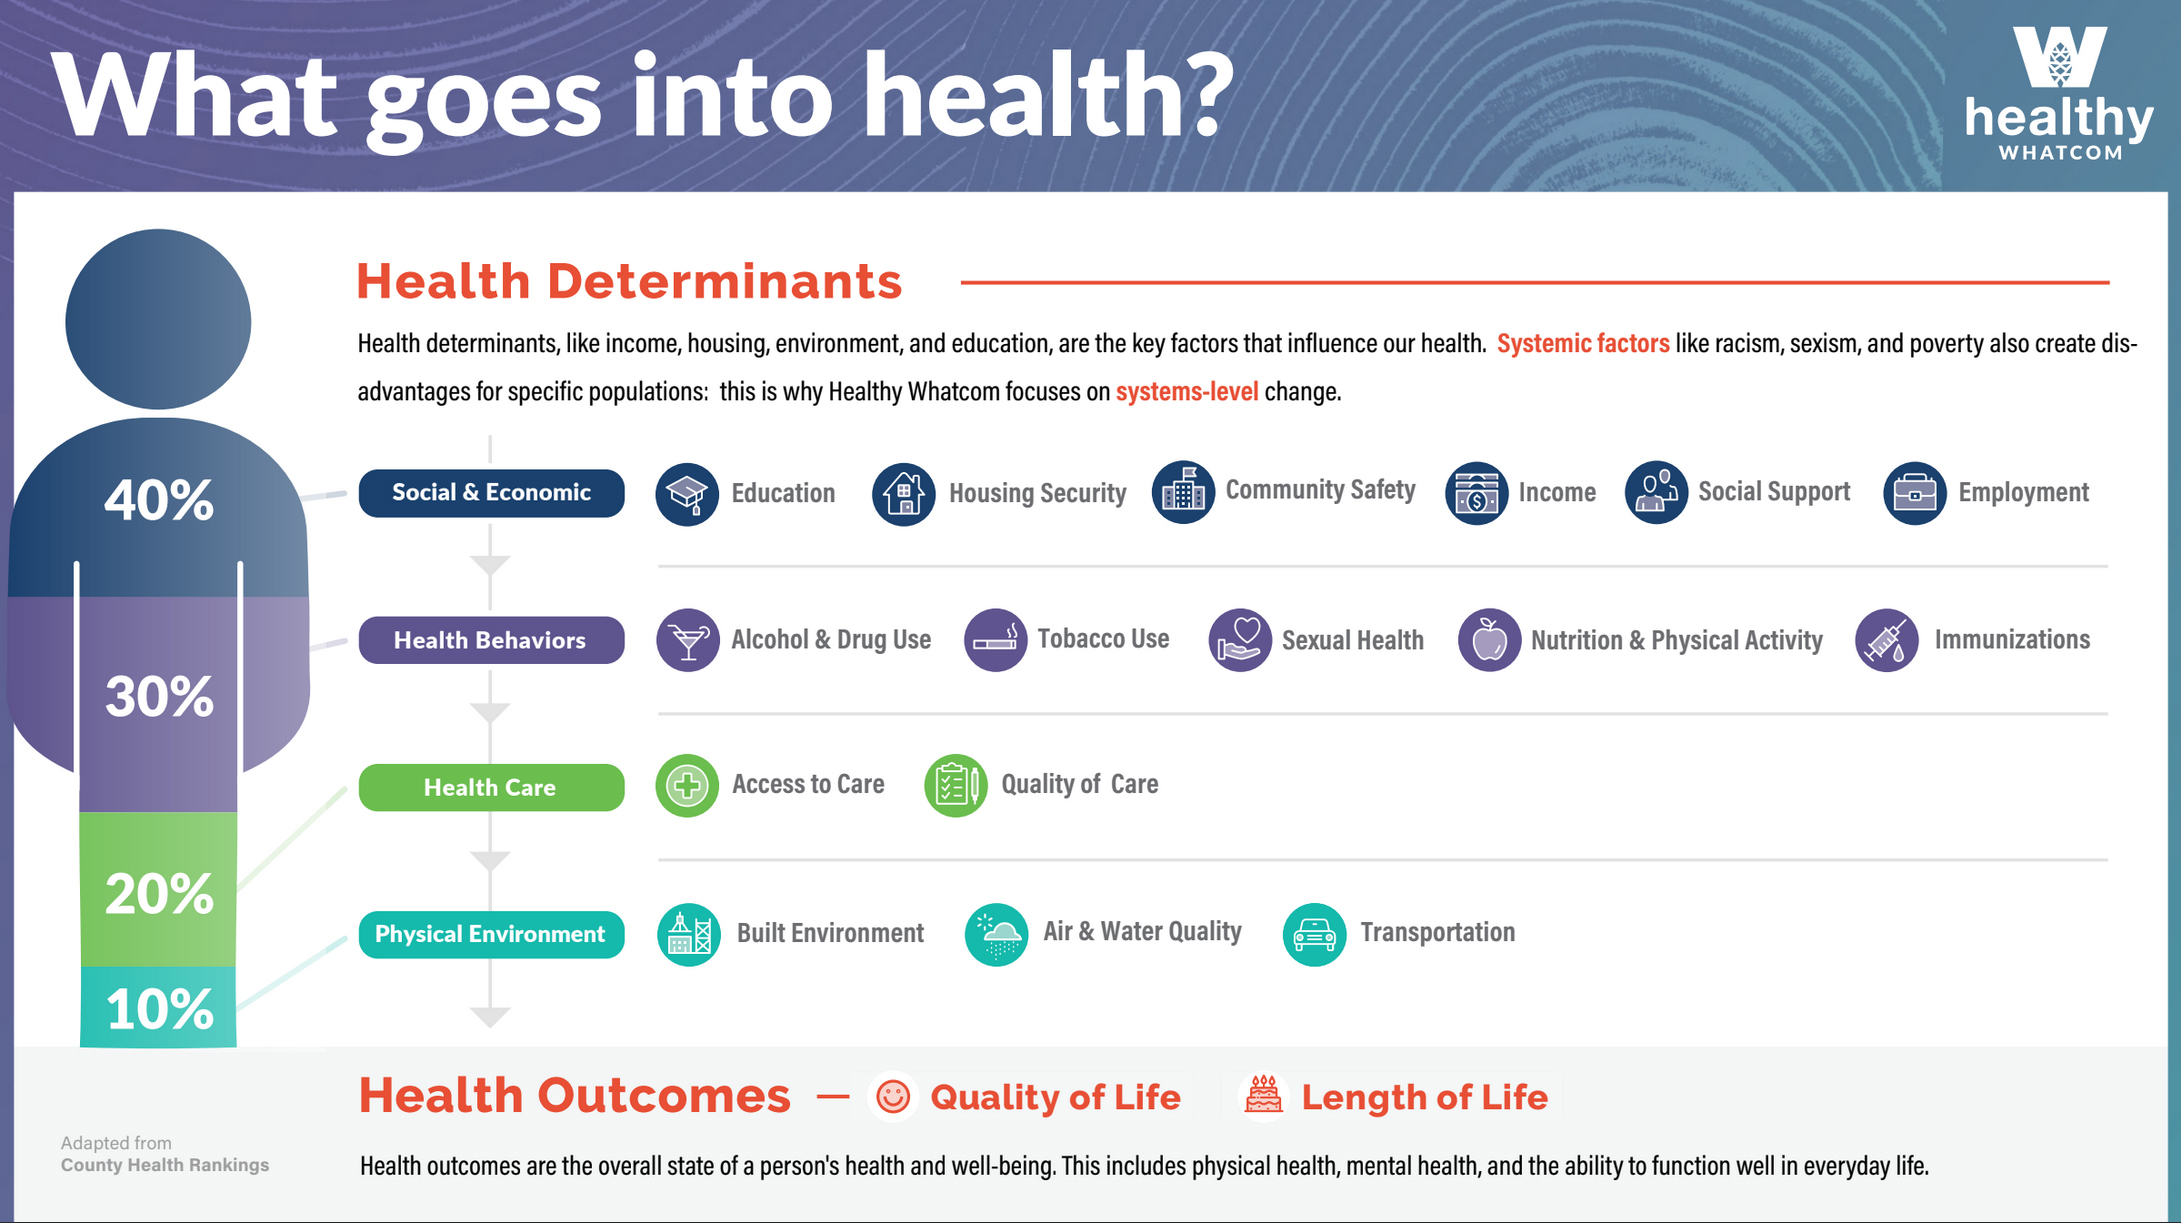
We also analyze data on health behaviors (like smoking rates), access to quality healthcare, and even how disease rates vary across different backgrounds and locations. This comprehensive approach allows us to identify areas where we can significantly contribute to community health and well-being.
According to the Population Health Framework, a community’s health and well-being can be understood by examining three key areas:
1. Health Outcomes
Health outcomes, such as disease and mortality, are the result of all the various factors that go into health.
2. Health Factors
Health factors are the “ingredients” that contribute to health, like environment, behavior, socioeconomic status, and access to care.
3. Policy, Programs & Practice
Policy and programs have a major influence on individual and collective health within our community.
Unfortunately, systemic barriers like racism, sexism, and poverty can significantly impact these outcomes. For example, racism can lead to discrimination in housing and employment, impacting access to healthy food and quality healthcare. This can contribute to higher rates of chronic diseases like diabetes and heart disease for people of color. Sexism can also limit access to preventive care and reproductive health services for women, negatively affecting their overall well-being.
Where does our data come from?
Healthy Whatcom combines quantitative and qualitative data to get a complete picture of health and well-being in Whatcom County.

Quantitative Data
Quantitative data is information based on numbers, which is measurable and often presented in statistics or charts. Great for measuring trends, comparing groups, and understanding prevalence (how common something is).
When to use:
- To assess the scope of a problem (e.g., how many people struggle with anxiety in a community).
- To evaluate program effectiveness (e.g., did a mental health awareness campaign increase help-seeking behavior?).
- To compare data across different groups or demographics.

Qualitative Data
Qualitative data is descriptive information involving words, text, images, or observations. It provides rich detail and helps understand experiences and motivations.
When to use:
- To gain deeper insights into people’s thoughts, feelings, and experiences (e.g., why people hesitate to seek help for mental health challenges).
- To explore new topics or understand complex issues.
- To inform the development of quantitative surveys or programs.
Essentially, quantitative data tells you “what” is happening, while qualitative data helps you understand “why” it’s happening. For example: A survey might tell you that a high percentage of teens experience anxiety, while focus groups could reveal the specific pressures and concerns causing that anxiety.
Health trends in Whatcom County
Our most recent Community Health Assessment (CHA) and Community Health Snapshots examine Whatcom County as a whole and seven geographic communities. Together, they help illuminate how peoples’ overall health and access to services within our community often correlate with race, socioeconomic status, and physical location. To see an in-depth breakdown of how the quantitative metrics and qualitative feedback that we collected have led us to these conclusions, you may download the full assessment and corresponding geographic snapshots below.
2018 Community Health Assessment
Our CHA is compiled via a systematic, comprehensive process of data collection and analysis that examines health and well-being across Whatcom County and identifies areas and populations having a better or worse experience.
2018 Community Health Snapshots
The 2018 Community Health Assessment and Community Health Snapshots take a look at Whatcom County as a whole and examine seven geographic communities.
- Bellingham
- Blaine
- Ferndale
- Lynden
- Meridian
- Mt. Baker
- Nooksack Valley
- Appendix (contains data tables that compare public health data across all school districts in Whatcom County)
Learn more about our work
Use the links below to learn more about our long-term goals and ongoing work.